Overview and Trends
in the Power Sector
The Case of the Gulf States
The future is electric
Global electricity demand is expected to rise 80% by 2040 1, driven by the electrification of various sectors. However, the sources of this electricity remain a subject of heated debate, particularly in hydrocarbon-rich Gulf Arab states.
Hefty renewable energy targets have dominated news and government announcements in the Gulf in recent years. However, Gulf economies and domestic power consumption remain almost entirely dependent on fossil fuels. Electricity consumption continues to rise as economic growth drives a race for thermal generation capacity, with renewable energy plans remaining slow to materialise.
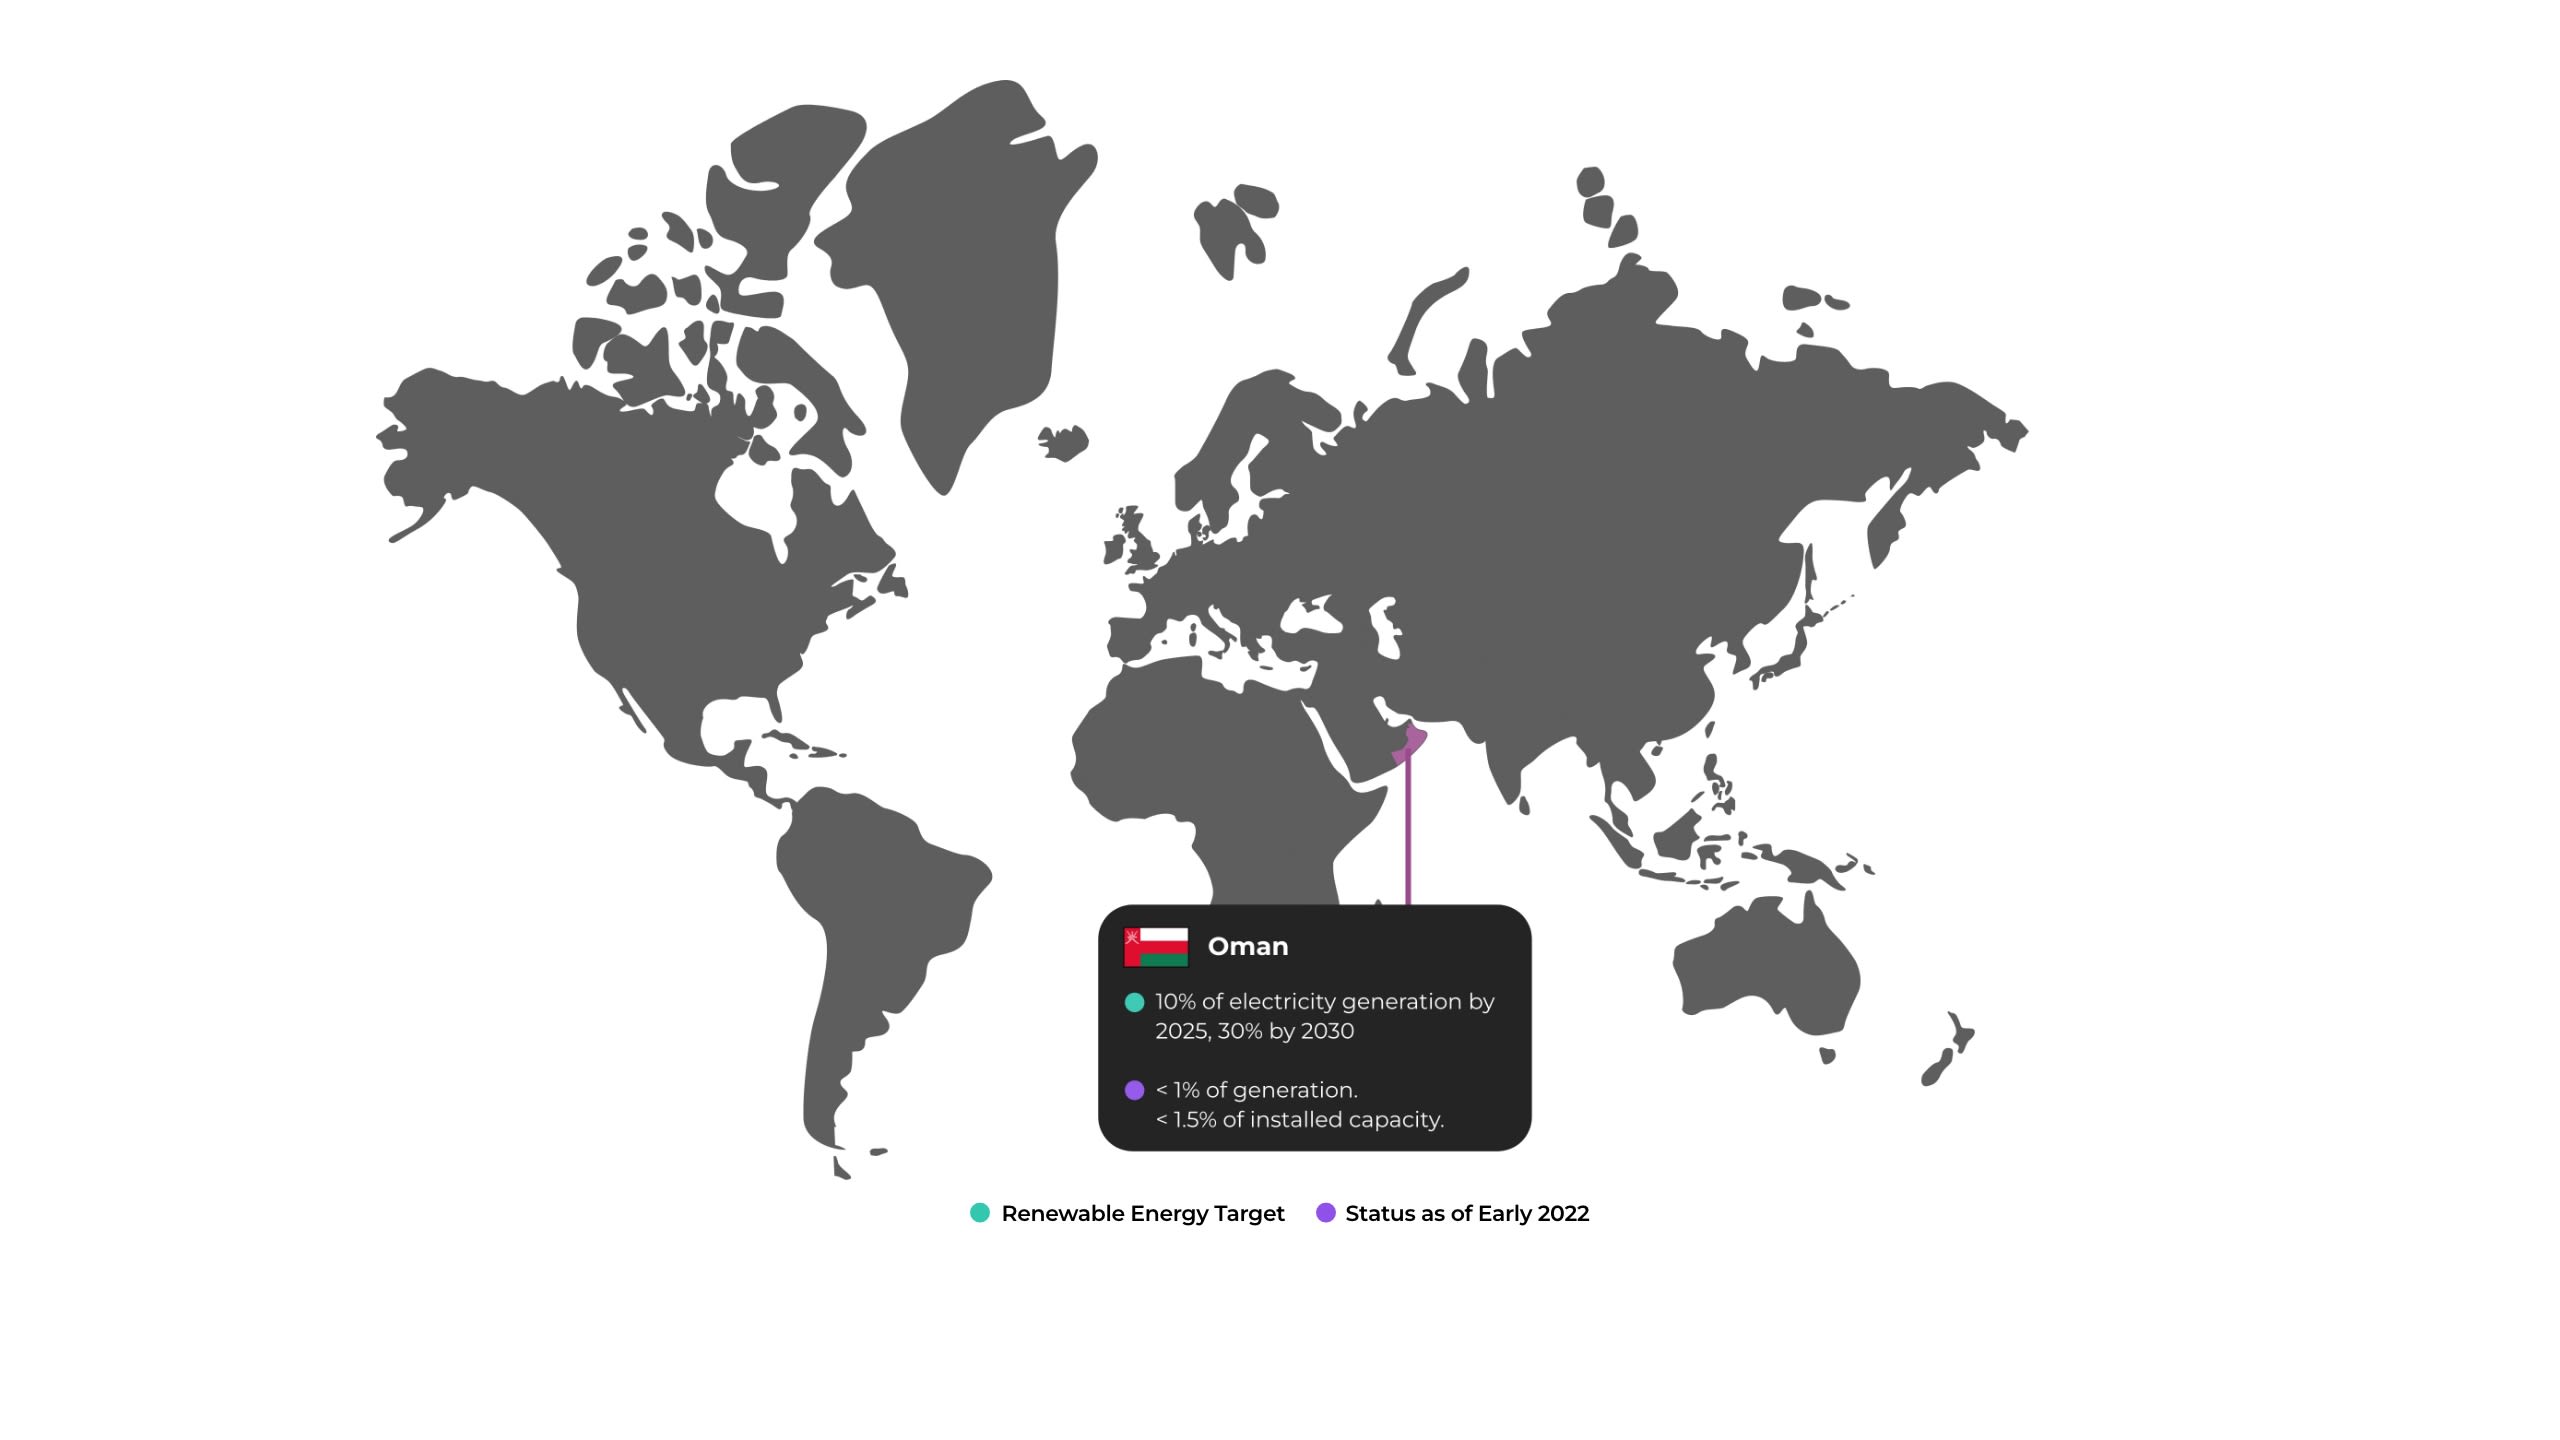
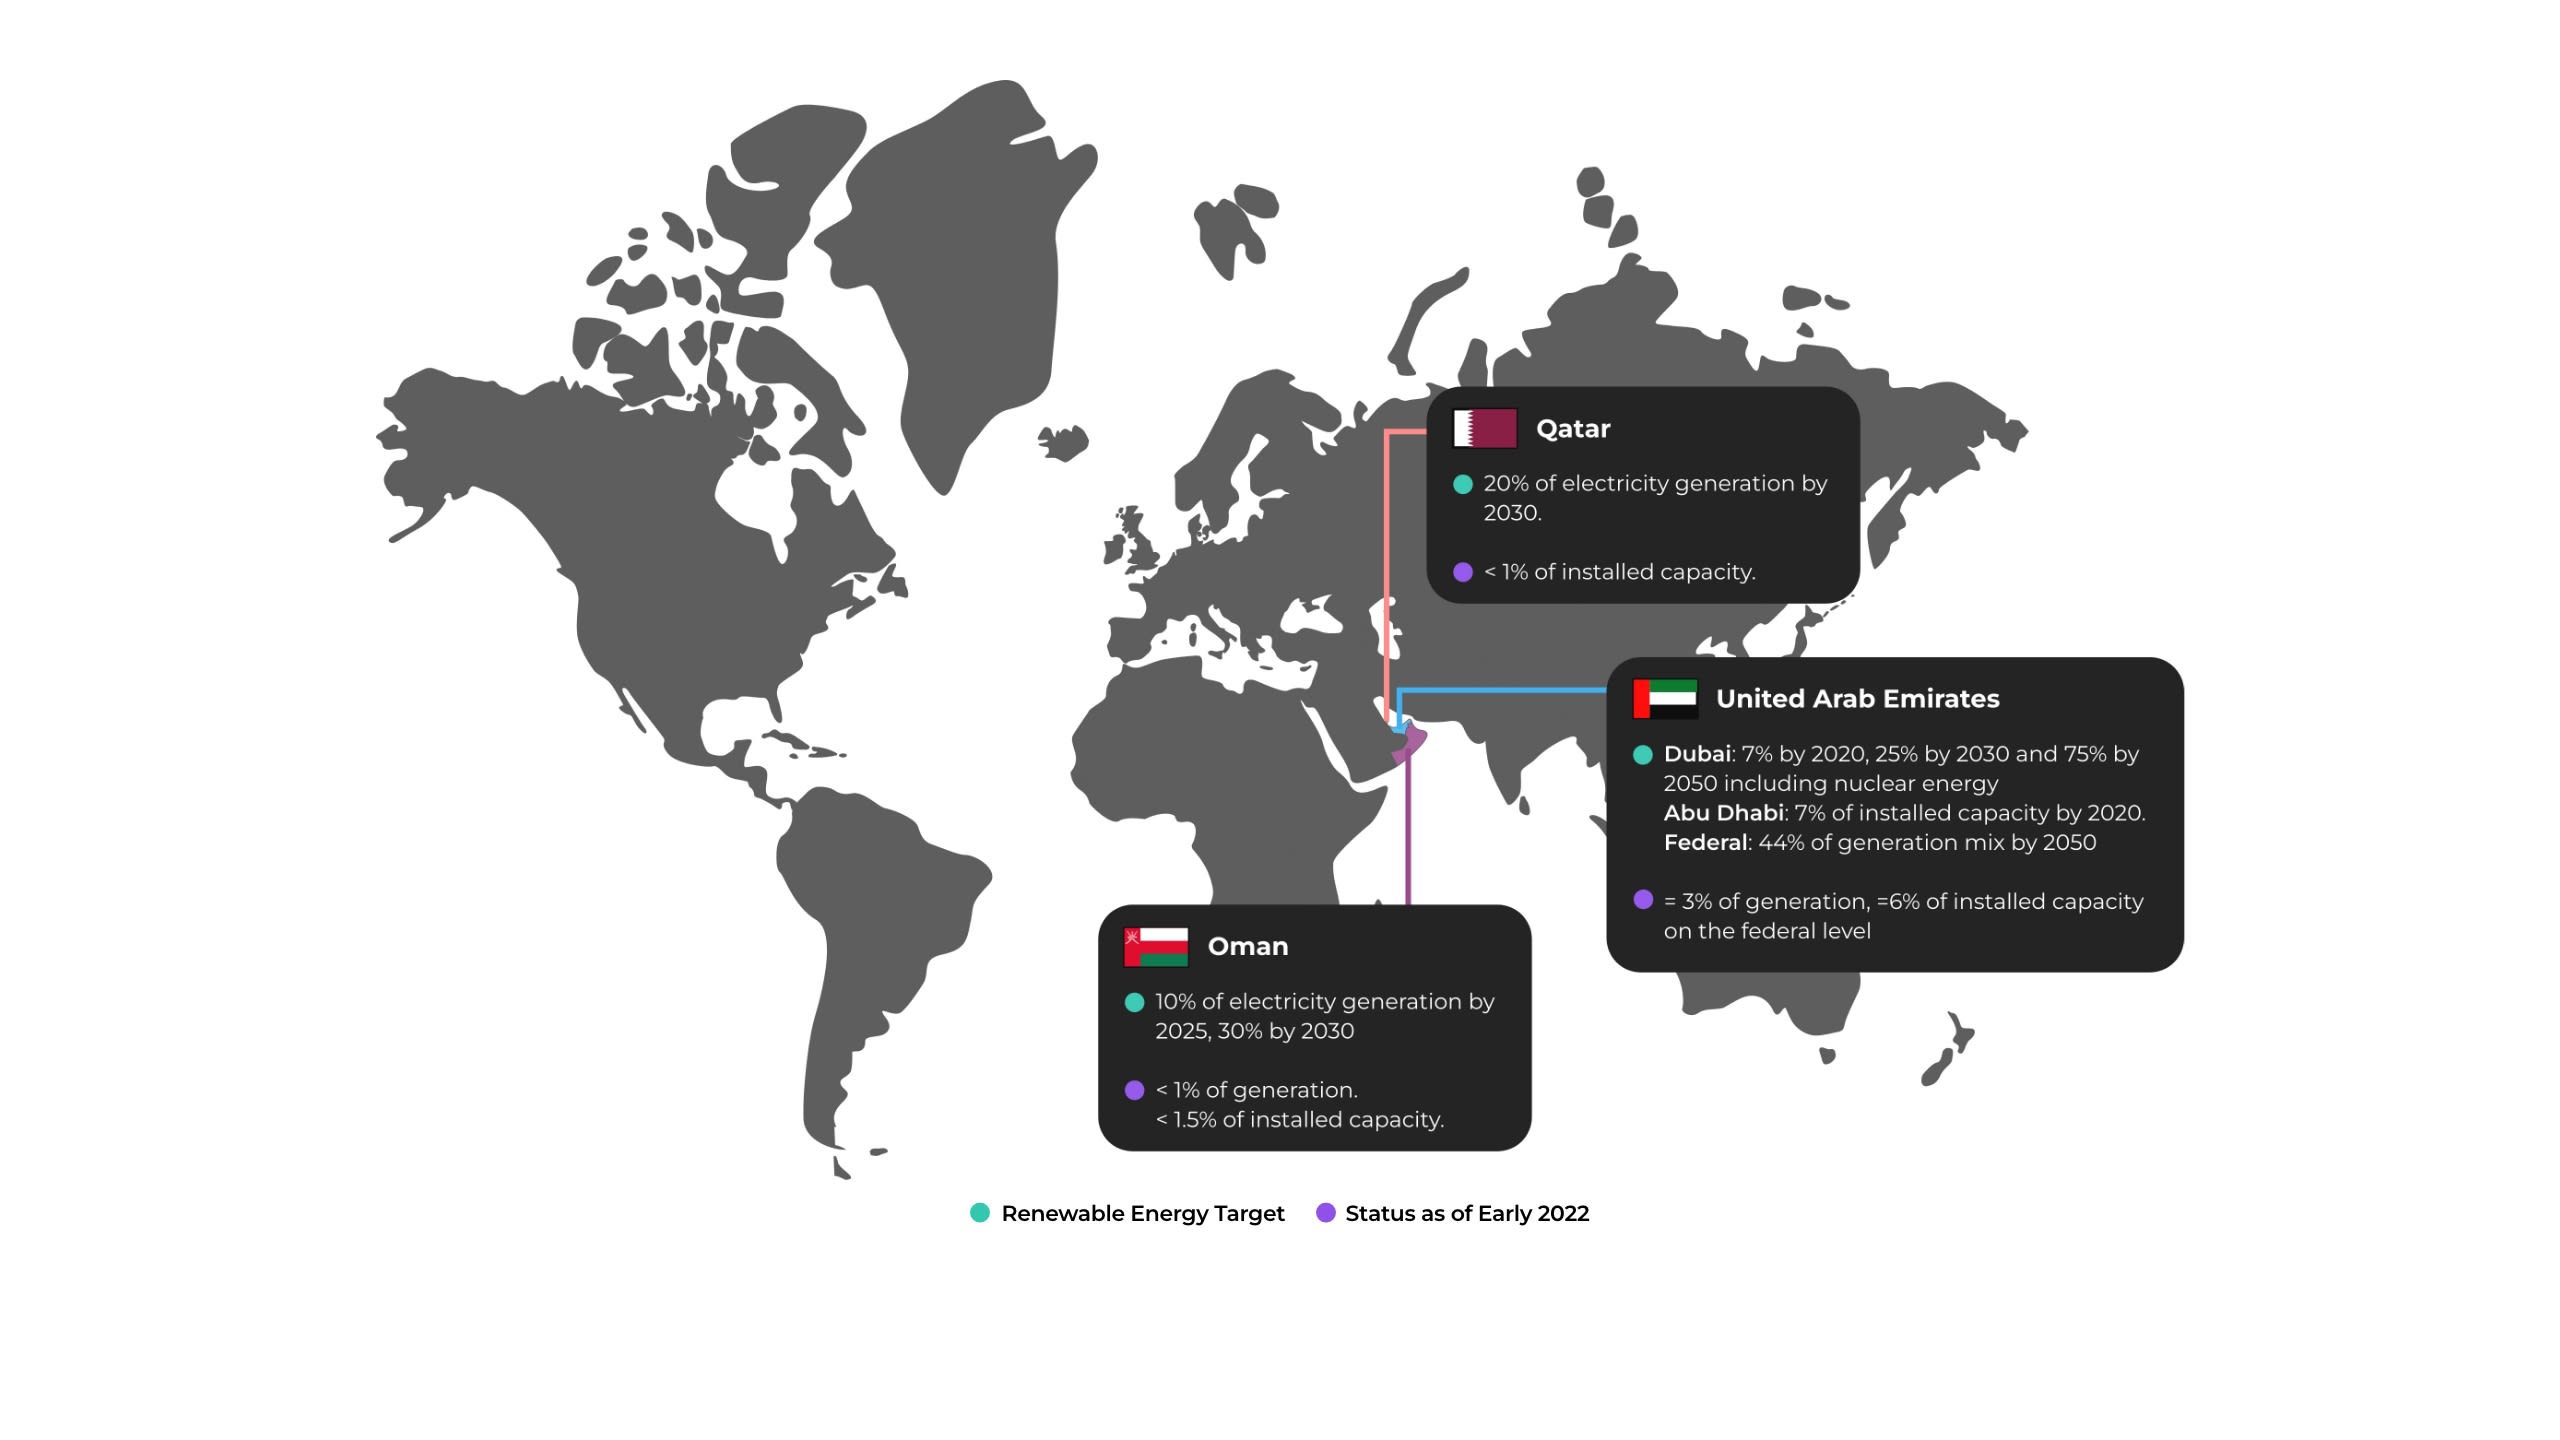
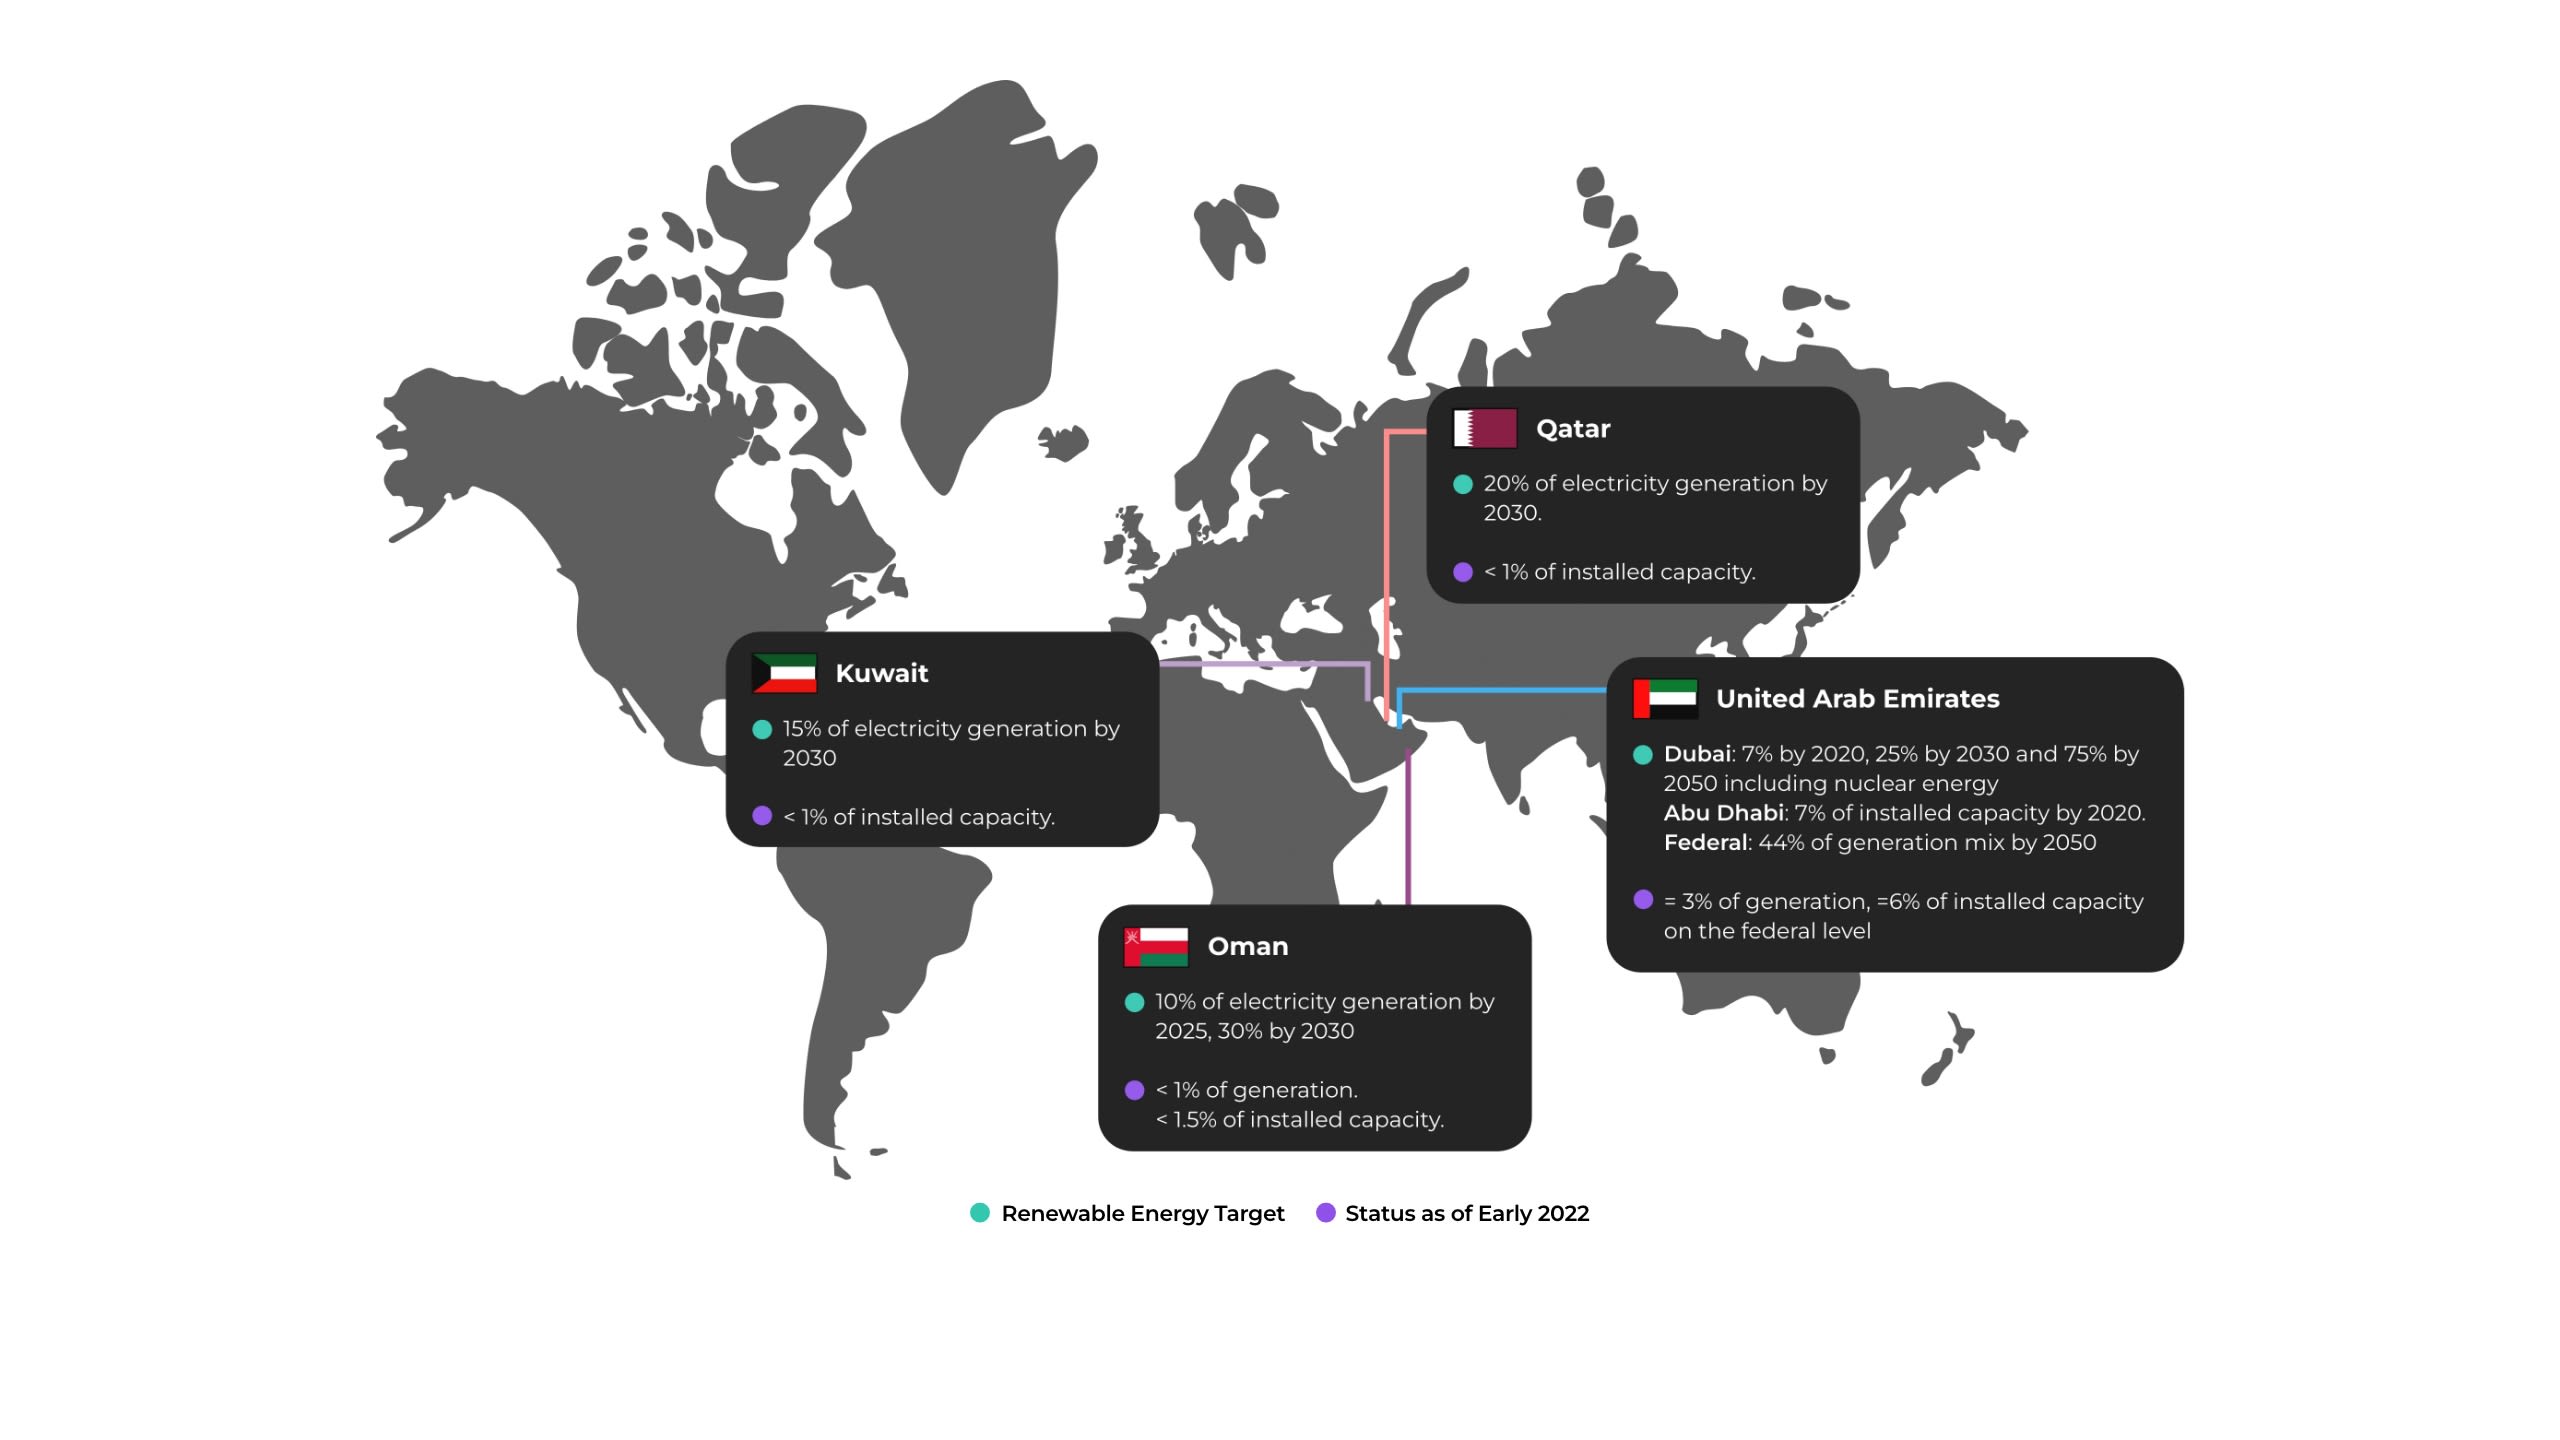
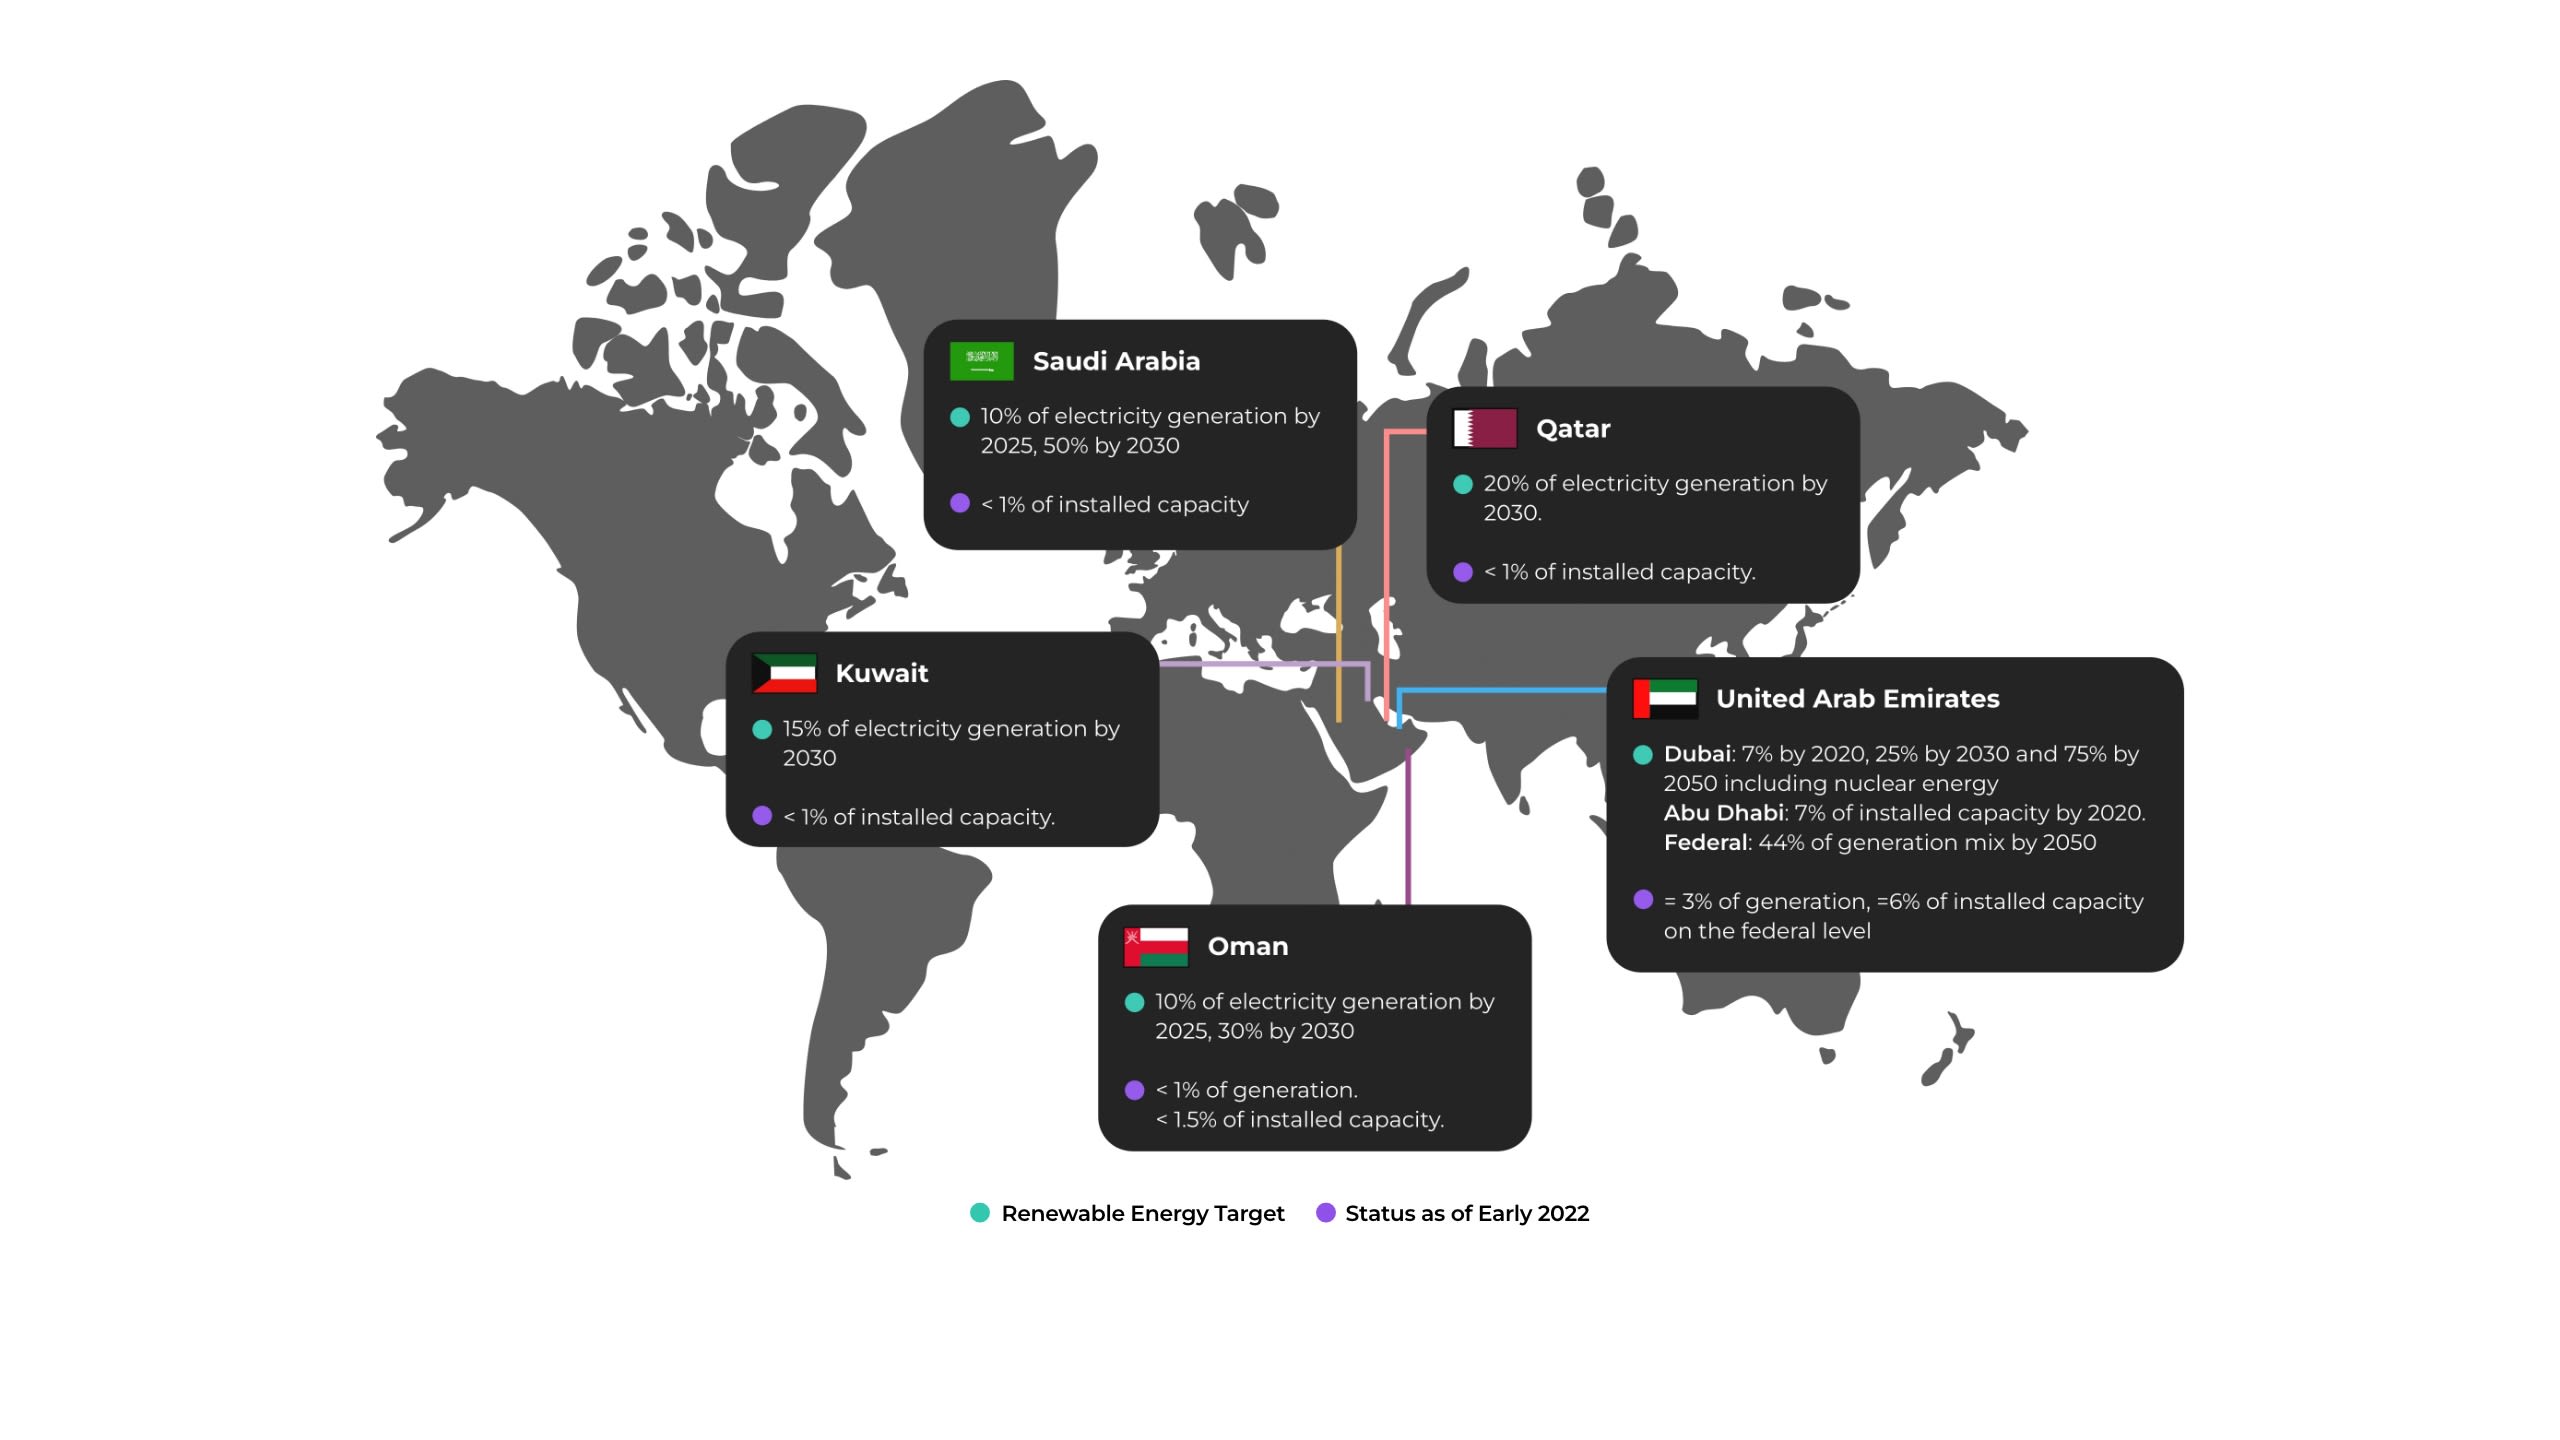
Diversifying the Gulf’s power mix is an extensive mission. Gulf states sit on a vast supply of hydrocarbon reserves. Revenues from these reserves have driven the region’s economies and played a central role in dictating the region’s political and economic dynamics. However, Gulf states are rich in other natural resources, with abundant renewable energy potential. These states have announced lofty targets for the deployment of renewable energy systems. The targets range from 15% to 50% of electricity generation by 2030. Despite a slow start, implementation is gaining momentum.


December 16, 2022
Key Takeaways:
- Electricity demand growth in the Gulf has fallen slightly. But several indicators imply that growth in electricity demand will recover to high levels in the future.
- Renewable energy deployment in Gulf states is gaining momentum driven by several factors, including freeing hydrocarbons, especially oil, for exports, and increasing energy security and job creation.
- Gulf states have an opportunity to fast-track renewable energy tenders and project development, mostly due to higher financing prospects and lower project development risks.
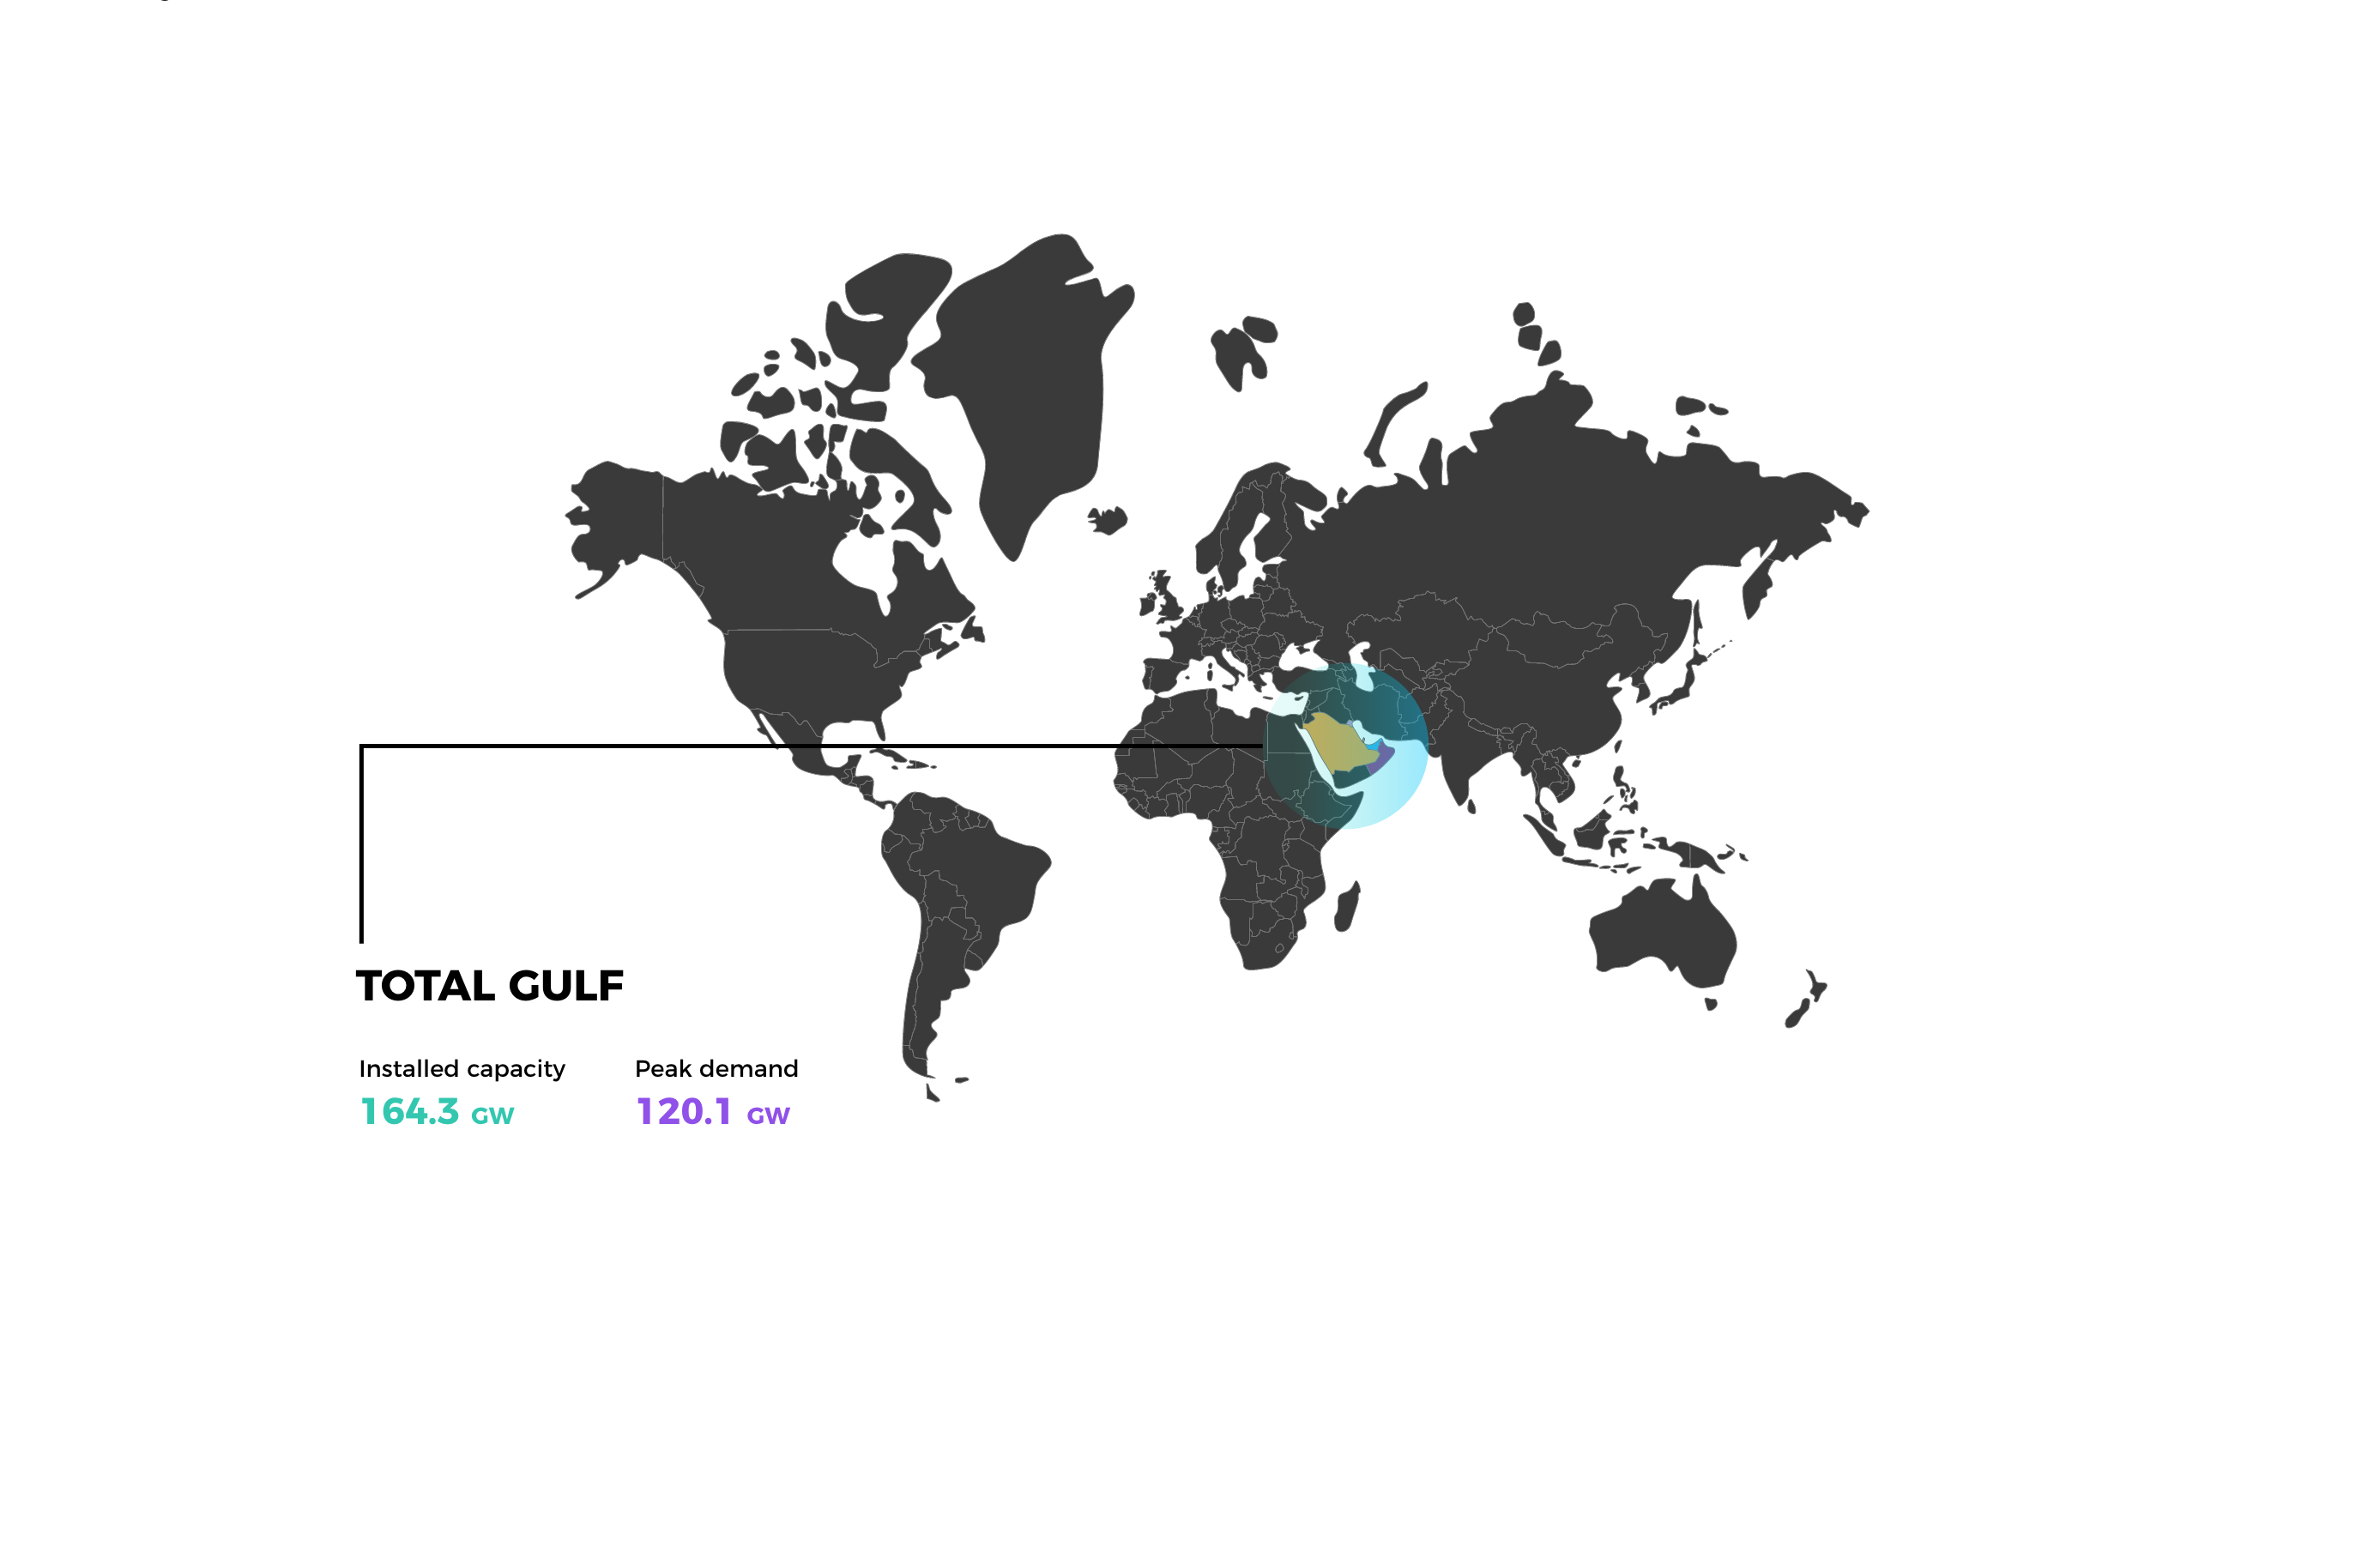
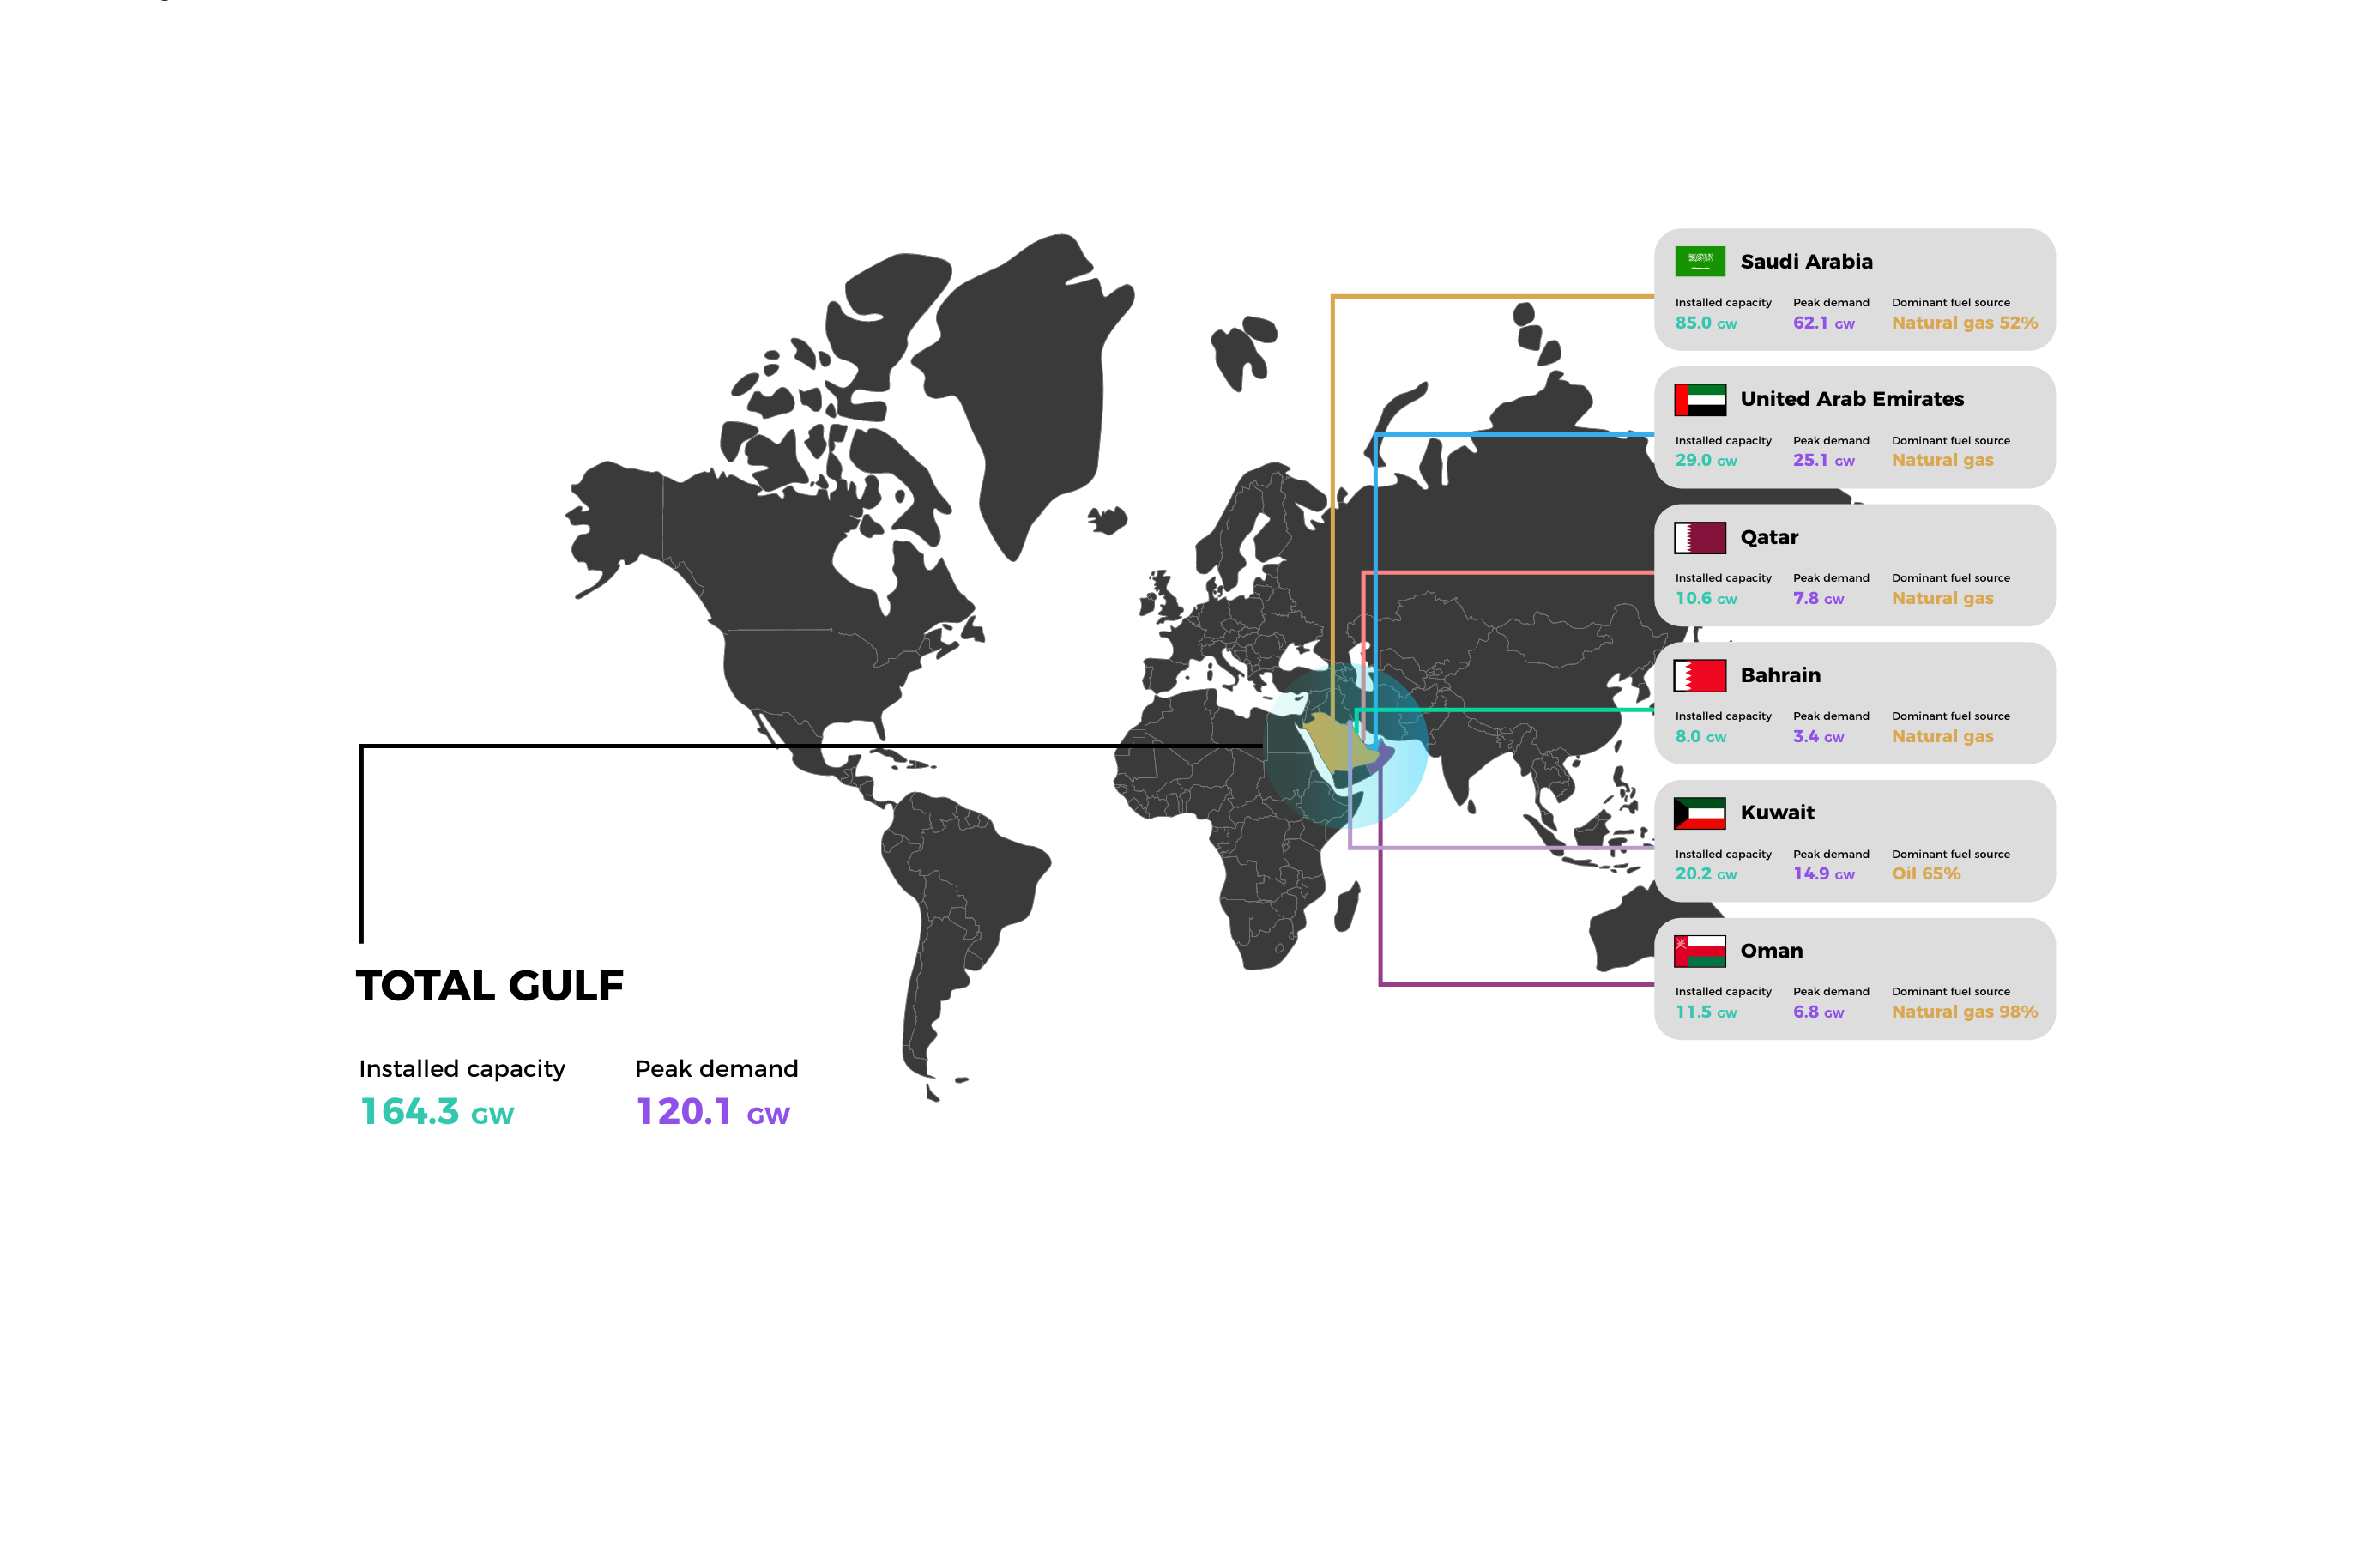
The Gulf’s current available power generation capacity is approximately 165 Gigawatts (GW), up from 154 GW in 2018, which accounts for half of the Middle East’s estimated total installed capacity. Peak electricity demand in the Gulf was in the vicinity of 120 GW in 2020 2.
Electricity demand growth in the Gulf has fallen slightly since 2016. Before this, the region’s peak electricity demand grew at unsustainable rates. Annual growth in peak demand averaged 7% to 11% from 2005 to 2015, and then dropped to 3% from 2016 to 2020 3. Historically, fuel and electricity subsidies, resulting in low electricity tariffs, have led to a wasteful increase in electricity consumption. This has caused a rise in domestic consumption of fossil fuels, the dominant source for power generation in the Gulf. Domestic reliance on subsidised fossil fuels has strained governments’ budgets and decreased the attractiveness and bankability of investments in low-carbon technologies, including renewables.
Despite the decreased peak demand growth rate, several indicators imply that growth in electricity demand will recover to high levels in the future. These factors include:
- Economic growth, which is still strongly linked to energy consumption (the two have not yet decoupled in GCC member states 4, unlike in Organisation for Economic Co-operation and Development (OECD) countries, where electricity demand has flattened)
- Water scarcity
- Rising temperatures and subsequent rising demand for cooling
- Electrification of sectors, including transportation
- Digitisation and the addition of data centres
Figure 1. Gulf peak demand annual growth rate
Demand growth has been driving a race to increase installed generation capacity, mainly in thermal generation. This generation is consuming a larger share of fossil fuels, diverted from exports. The annual growth rate of installed generation capacity in the Gulf is 7%, although it exceeded 9.5% 5 from 2005 till 2015. This compares to a global rate of 6% for thermal generation.6
Gulf electricity generation, demand and dominant fuel sources for power
generation in 2020
Data source: WERA, DEWA, EWEC, QEWC, OPWP, Kuwait MEW, MEES


Despite available reserve margins, the increase in peak demand at extreme temperatures has driven power outages in cities in Kuwait, intensifying efforts to secure installed capacity. The state has a pipeline of eight additional power plants with a combined generation capacity of 17.3 GW planned for operation by 2035.
According to data from the International Energy Agency (IEA), the residential sector was the highest electricity consumer in the Gulf in 2019, accounting for approximately 41% of total electricity consumption, followed by the commercial and governmental sectors at a combined 34%. The residential sector is currently the highest consumer across all Gulf states except Bahrain, where the industrial sector consumes the most, followed by the residential sector. In 2015, the largest consumers in the United Arab Emirates (UAE) were the commercial and governmental sectors, with the residential sector coming in a close second. The Covid-19 pandemic has shifted consumption towards the residential sector in the UAE. Buildings constitute the largest electricity consumer, with air conditioning making up the highest share of electricity consumption. Thus, electricity consumption increases as temperatures rise.
Most sectors in the Gulf have seen an upward trend in electricity consumption. Exceptions are Saudi Arabia, where the residential sector’s consumption has been decreasing and commercial and governmental sector consumption has mostly stagnated since 2015, and Qatar, where the industrial sector has been mostly flat since 2015. The agricultural sector has generally plateaued across all Gulf states.
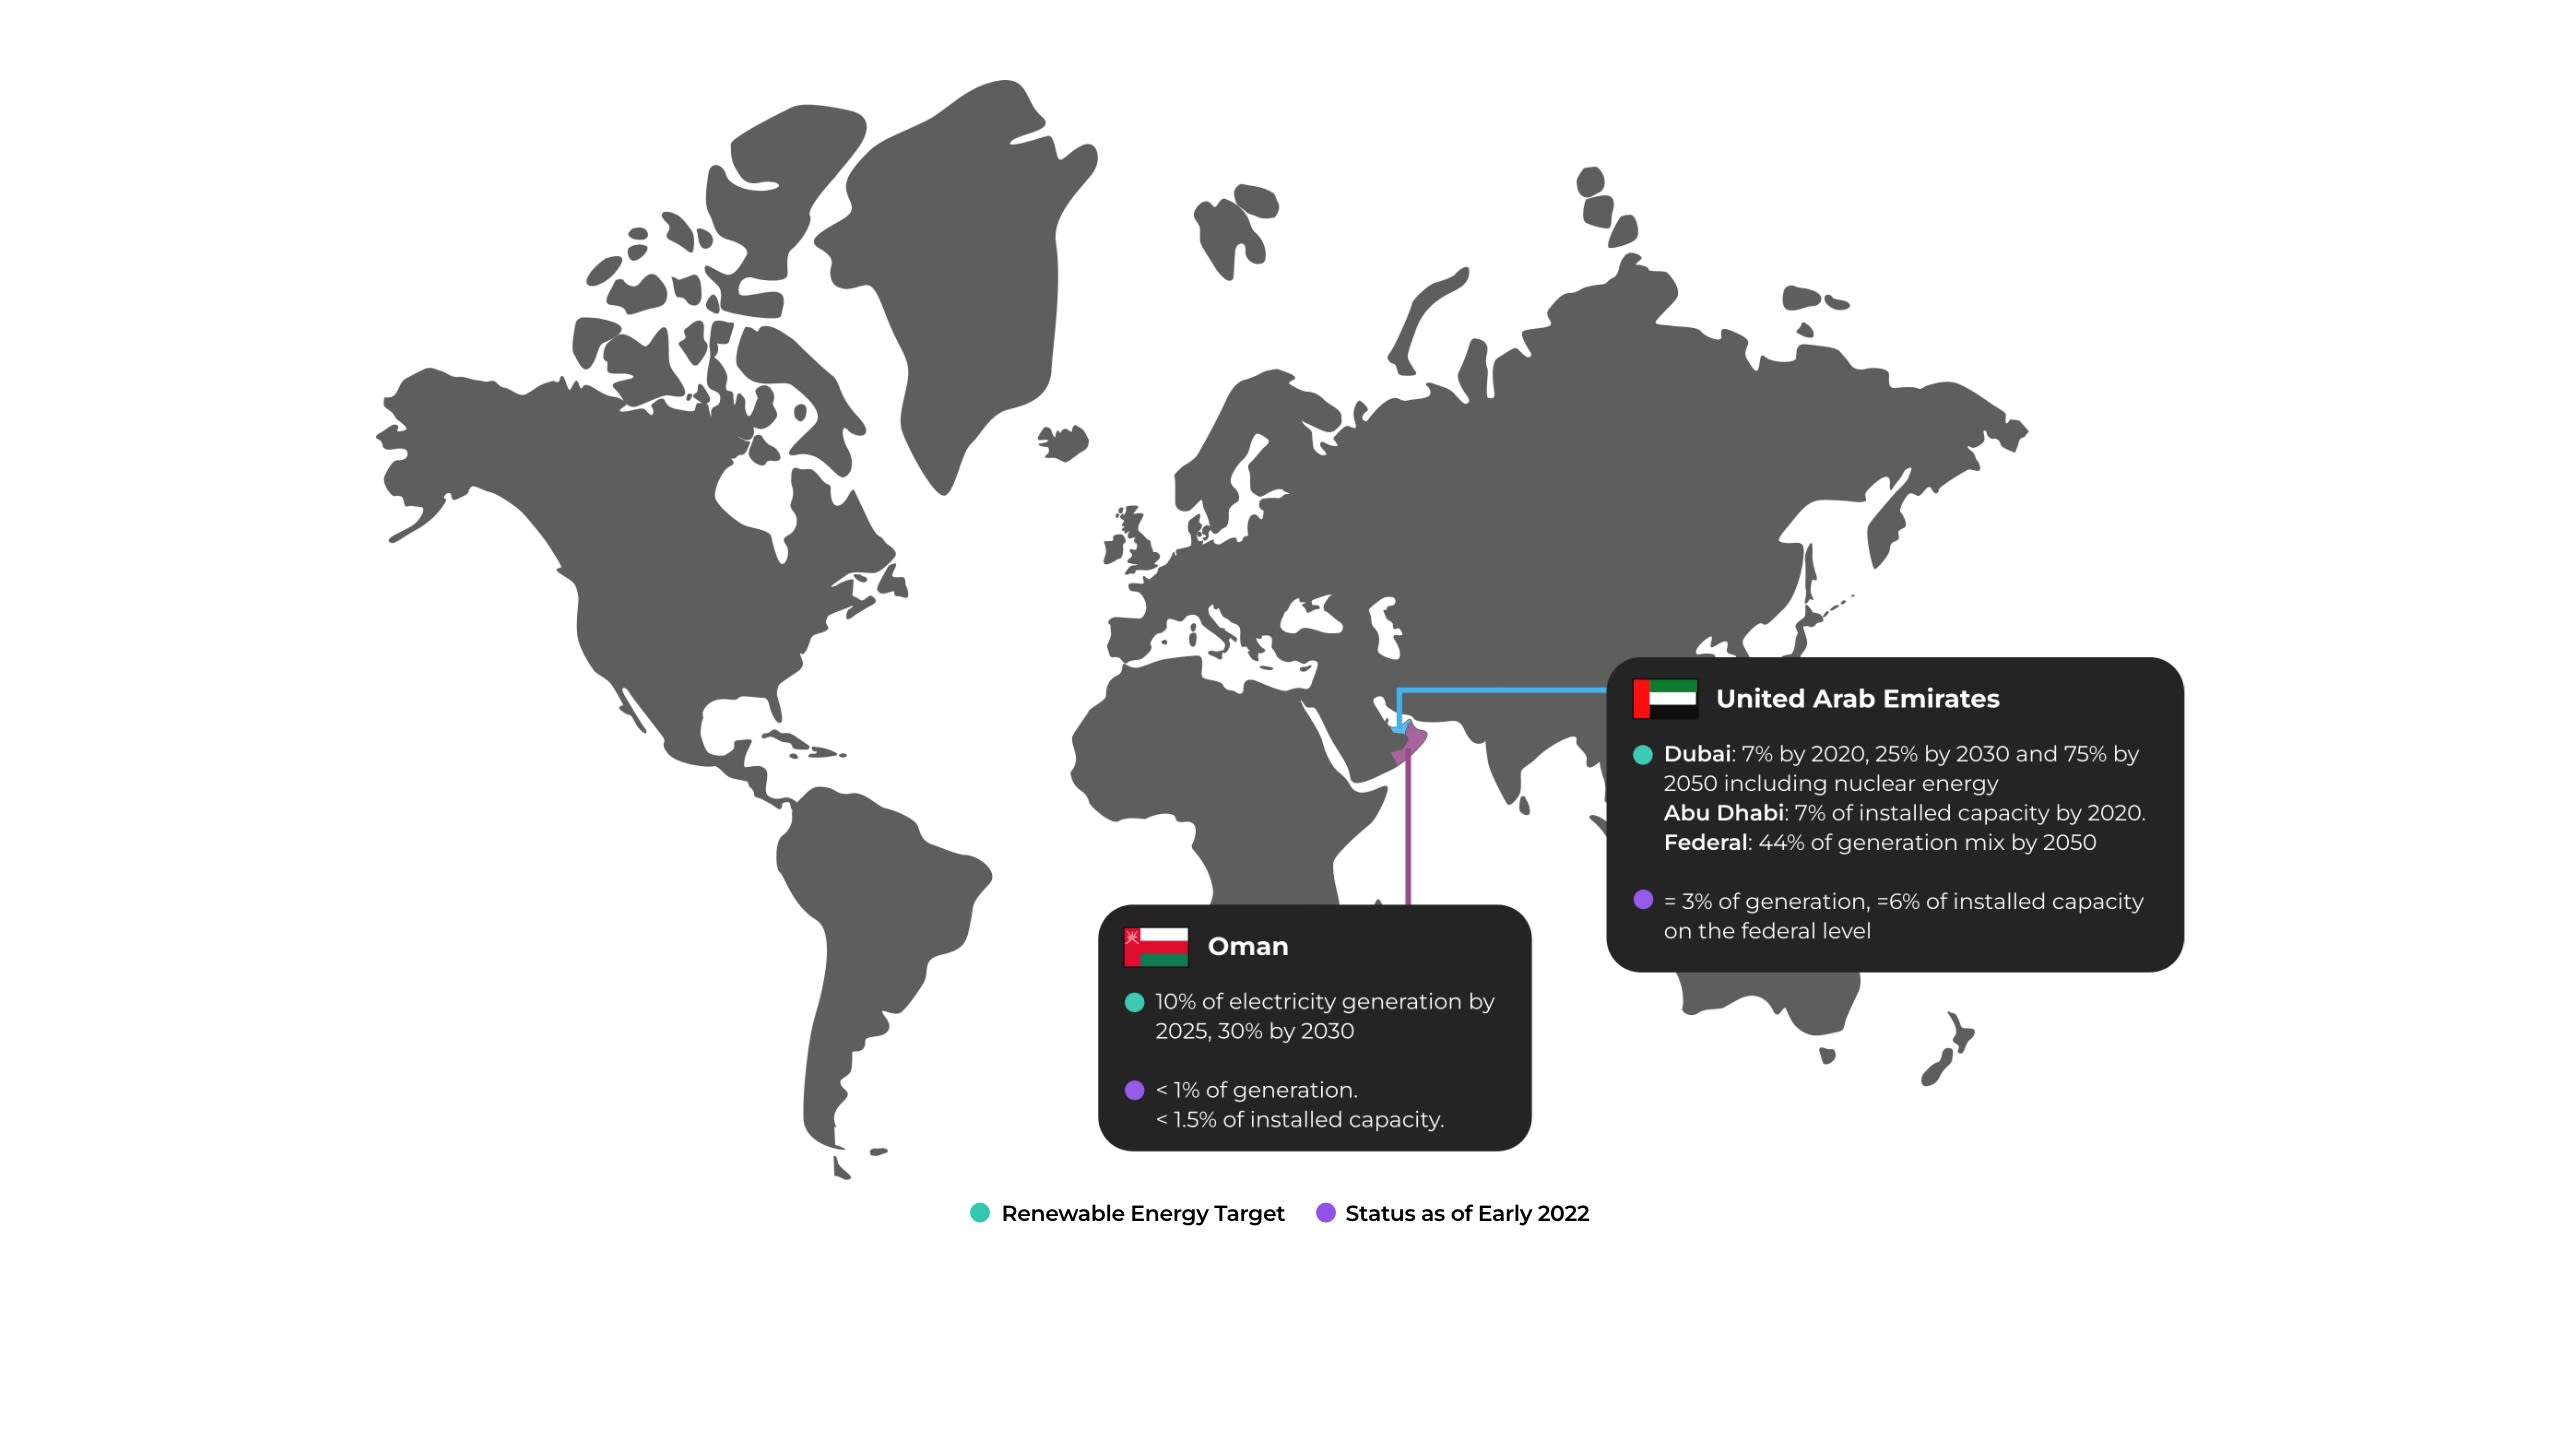
Gulf Renewable Energy Targets


Maintaining this downward trend will be necessary to achieve a more sustainable Saudi power sector. This should be coupled with a downward trend in thermal generation capacity and a hike in renewable energy systems use. A rising share of renewable energy in the power mix cannot take place without net reduction and decommissioning of fossil fuel-powered generation.
Renewable energy investment building in the Gulf
Renewable energy has yet to make a dent in the Gulf power sector. The Gulf has only deployed 3.67 GW 7, equivalent to less than 1% of the states’ installed power generation capacity and even less as a share of 2020 global renewable energy capacity, which was 1,588.5 GW (non-hydro) 8. Globally, the year 2020 witnessed record additions of renewable energy capacity, despite the Covid-19 pandemic. However, this trend was not evident in the Gulf states, which added only 722 Megawatts (MW) of solar generation capacity, compared to a global total addition of 127 GW. Total solar energy capacity in the Gulf stood at 3.2 GW by the end of 2020, equivalent to less than 1% of the global solar generation capacity of 714 GW. Wind energy capacity in the Gulf rose from 66 MW to 466 MW with the commissioning of the Dumat Al Jandal wind farm in Saudi Arabia in August 2021. Meanwhile, global onshore and offshore wind capacity totals 733 GW, with 111 GW added in the year 2020 9.
Figure 2. Solar and wind capacity in Gulf states (in MW) Data source: IRENA statistics
Several factors are driving momentum for renewable energy deployment among Gulf states. Most cited factors are:
- Planning for a post-oil world
- Freeing hydrocarbons, especially oil, for exports
- Job creation
Another important driver is energy security, which is interlinked with natural gas supply security and is susceptible to political risk. The most obvious consequence of the Gulf’s increasing electricity consumption has been the region’s growing reliance on natural gas for power generation, with associated shortage risks. This trend tightens the export potential of some Gulf states while increasing the need for gas imports for others – mainly Bahrain, Kuwait and UAE.
The International Renewable Energy Agency (IRENA) lists other factors that are driving the surge in renewables in the Gulf: renewables are the most practical and readily available climate solution; they are abundant in the Gulf and present the most competitive form of power generation; they present the opportunity to save water.10
These drivers both match and contrast with the drivers for renewable energy investments in other markets. In China (which boasts the world’s largest installed generation capacity from hydropower, solar and wind energy), the main investment drivers aim to mitigate the environmental and health impact of the country’s chronic reliance on coal-fired power generation and provide access to electricity through off-grid supply to approximately 2 million rural households 11. In the United States, renewable energy has boomed due to a need to create jobs and reduce reliance on oil imports, as well as due to consumer demand for cleaner fuels and climate change mitigation. Some 67% of Americans say that the federal government is not doing enough to protect the environment, according to a survey by Pew Research Center 12. In developing countries, renewable energy deployment aims to maintain economic growth while meeting environmental targets.13
The various drivers, energy needs, and governance models have shaped different countries’ policies and energy priorities. These considerations, in addition to differences in economic prospects, climate conditions and other local drivers, make comparisons difficult to analyse. However, some trends are assessed below to identify the barriers and opportunities Gulf states face as they increase their shares of renewable energy.
Renewable tenders accelerate in the Gulf
Tenders are the dominant procurement model for the Gulf’s renewable energy systems, but direct negotiations are gaining traction. These are motivated by the prospects of realising competitive, low prices. Auctions for renewable energy have gained traction across the world over the past decade. The number of countries adopting such auctions increased from six in 2005 14 to 55 in 2017–2018 15. More recent data was not available.
The Gulf’s first renewable energy auctions took place in the UAE in 2014. They became increasingly popular and were kick-started in other Gulf states in 2017. The timeframes and levels of adoption of renewable energy vary across and within regions, including in Europe and Asia (outside the Middle East).
In 2014, the Dubai Electricity and Water Authority (DEWA) launched a bid to implement a 100-MW solar photovoltaic (PV) plant as the second phase of the Mohammed bin Rashid Al Maktoum Solar Park. This second phase was announced in 2012 alongside the commissioning of a 13-MW PV plant in the first phase. The plant’s 100 MW capacity was later increased to 200 MW. The third phase – of 800 MW - was auctioned in 2016. Both the second and third phases set record low prices of $5.85 and $2.99 per kilowatt hour (kWh), respectively.
Saudi Arabia’s first auctions took place in 2017 with the Ministry of Energy’s Renewable Energy Project Development Office’s (REPDO) launch of tenders for the 300-MW Sakaka solar PV and 400-MW Dumat Al Jandal wind plants. REPDO is set to auction 30% of Saudi renewable energy target projects, while the Public Investment Fund (PIF) oversees the development of the remaining 70% through direct negotiations 16.
Mega-scale projects constitute more than 90% of the share of utility-scale single site projects larger than 250 MW in the Gulf. The US Energy Information Administration (EIA) defines utility-scale projects as having capacities larger than 1 MW 17. Globally, the bulk of utility-scale projects range between 2 MW and 250 MW. Since utility-scale renewable energy projects benefit from economies of scale and are cost-competitive, they have dominated in many markets, such as the US, where these systems accounted for 61% of cumulative solar capacity in 2021 18. However, these utility-scale solar PV plants have individual capacities of 5 MW or lower 19.
Supportive government policies and financing mechanisms have driven a shift towards distributed renewable energy systems. These systems have played major roles in increasing renewable energy consumption, particularly in European countries. In France, utility-scale capacities constitute just 40% of total solar PV capacity. In Norway, the share of utility-scale PV is minimal. In China, distributed solar constituted more than 30% of 2019 solar additions 20. In the UK, similar to the US, 35% of solar PV project capacities range from 1 to 5 MW. While this range is considered utility-scale, these capacities are insignificant compared to the Gulf’s mega-projects, detailed below. But they showcase the importance of lower-system capacities in increasing the cumulative share of installed renewables.
Plants in the Gulf have been breaking global records in terms of capacity of single-site solar PV plants. In 2016, Dubai’s 800-MW solar PV plant was among the largest single-site plants auctioned, along with a plant of similar capacity in China.
The capacity of these mega-projects has increased over time. Saudi Arabia’s Sudair solar PV plant has 1.5 GW of capacity, the result of a $907m investment that was awarded by the PIF in 2021. Abu Dhabi’s 2-GW Al Dhafra solar PV was considered the world’s largest single site solar plant in 2021, backed by a $1bn investment. From 2016 to 2021, mega solar PV plants with capacities of 600, 800, 900 MW and 1.2 GW were tendered and awarded, mainly in Saudi Arabia and the UAE. Mega-projects could portray a race for “symbolic power” and “rivalry for primacy” among global cities 21. Yet, these capacity ranges are necessary to enable the Gulf states to advance towards renewable energy development.
Gulf states have an opportunity to fast-track renewable energy project development compared to many developed and developing countries, mostly due to higher financing prospects and lower project development risks, especially those involving licensing and land acquisition. However, the regulated power market characterised by a single-buyer-model in the Gulf can present challenges related to the pace of integration of renewable energy projects. Additionally, any delays in requests for qualifications for developers by officials, shortlisting of bidders, and tendering would all be factors that would affect project development. Such delays have been witnessed in the past in Gulf states and have resulted in the delayed development of the renewable energy market.
Once a tender is awarded and the developer has financially closed by raising equity and debt requirements, securing grid connection in project development in Saudi Arabia and the UAE is faster than in other countries. Saudi Arabia’s first utility-scale solar PV project, Sakaka, was launched for bidders’ shortlisting at the end of 2017 and was awarded in November 2018. The project achieved financial close that same month, thus allowing the developers to start construction. A year later, in November 2019, the plant was connected to the grid.
The centralised approach to policymaking has kick-started the renewable energy industry, helped deploy mega-projects and raised investor and financier confidence in the technology’s performance and the market. However, a different approach is needed to diversify the power sector from conventional power generation to renewable energy and contribute to reaching the Gulf’s ambitious renewables targets. This approach should include other mechanisms of renewable energy procurement. Gulf countries have experienced success in the past, with a demonstrated ability to take projects from conception to fruition quickly. Thus, ensuring a short timeline for projects from conceptualization to development through other procurement models is feasible via measures including standardisation of tendering, restructuring of the power market and creating one-stop-shops for licensing.
References
1 International Energy Agency (IEA) (2021). “World Energy Outlook 2021”. https://www.iea.org/reports/world-energy-outlook-2021
2 Calculated by Author as per data from Saudi Water and Electricity Regulatory Authority (WERA), Dubai Electricity and Water Authority (DEWA), Emirates Water and Electricity Company (EWEC), Qatar Electricity and Water Company (QEWC), Oman Power and Water Procurement Company (OPWP), Kuwait Ministry of Electricity (MEW), MEES.
3 Ibid.
4 Howarth, N., Galeotti, M., Lanza, A. et al. (2017). “Energy Consumption and Economic Development in the GCC: An International Sectoral Analysis”. Energy Transit 1: 6. https://doi.org/10.1007/s41825-017-0006-3
5 Calculated by Author as per data from WERA, DEWA, EWEC, QEWC, OPWP, Kuwait MEW, MEES.
6 IEA (2021). “Electricity Market Report: January 2021”.
https://iea.blob.core.windows.net/assets/d75d928b-9448-4c9b-b13d-6a92145af5a3/ElectricityMarketReport_January2022.pdf
7 Including solar photovoltaic, concentrated solar power, onshore wind and bioenergy.
8 International Renewable Energy Agency (IRENA) (2021). “Renewable Energy Capacity Statistics 2021”. https://www.irena.org/publications/2021/March/Renewable-Capacity-Statistics-2021
9 Ibid.
10 IRENA (2019). “Five Reasons why Countries in the Region are Turning to Renewables”. 20 October. https://www.irena.org/newsroom/articles/2019/Oct/Five-Reasons-Why-Countries-in-the-Arabian-Gulf-are-Turning-to-Renewables
11 National Academies of Sciences, Engineering, and Medicine (2010). “The Power of Renewables: Opportunities and Challenges for China and the United States”. https://doi.org/10.17226/12987.
12 Pew Research Center (2019). “US Public Views on Climate and Energy”. https://www.pewresearch.org/science/2019/11/25/u-s-public-views-on-climate-and-energy/
13 Dobrotkova, Z., Surana, K. and Audinet, P. (2018). “The Price of Solar Energy: Comparing Competitive Auctions for Utility-scale Solar PV in Developing Countries”. Energy Policy 118. https://www.sciencedirect.com/science/article/abs/pii/S0301421518301708
14 IRENA (2017). “Renewable Energy Auctions: Analysing 2016”. https://www.irena.org/publications/2017/Jun/Renewable-Energy-Auctions-Analysing-2016
15 IRENA (2019). “Renewable Energy Auctions: Status and Trends Beyond Price”. https://www.irena.org/publications/2019/Dec/Renewable-energy-auctions-Status-and-trends-beyond-price
16 Kingdom of Saudi Arabia (2021). “Public Investment Fund Program 2021-2025”https://www.vision2030.gov.sa/media/mdppqvmv/v2030_pif_2025_en.pdf
17 EIA (2019). “Most Utility-Scale Solar Photovoltaic Power Plants are 5 Megawatts or smaller”.https://www.eia.gov/todayinenergy/detail.php?id=38272#
18 Bolinger, M., Seel, J., et al. (2021). “Utility-Scale Solar 2021 Edition”. Lawrence Berkeley National Laboratory. https://emp.lbl.gov/sites/default/files/utility_scale_solar_2021_edition_slides.pdf
19 EIA (2019). op. cit.
20 Hove, A. (2020). “Current direction for renewable energy in China”. The Oxford Institute for Energy Studies. https://www.oxfordenergy.org/wpcms/wp-content/uploads/2020/06/Current-direction-for-renewable-energy-in-China.pdf
21 Al Saidi, M. (2020). “From Economic to Extrinsic Values of Sustainable Energy: Prestige, Neo-Rentierism, and Geopolitics of the Energy Transition in the Arabian Peninsula”. Energies 2020, 13(21): 5545. https://www.mdpi.com/1996-1073/13/21/5545